
Objective:
In this laboratory you will study the emission of light from a hydrogen discharge source. You will measure the wavelengths of the visible lines in the Balmer series and and analyze your data to determine the Rydberg constant.
Background information:
When an electron changes from one energy level to another, the energy of the atom must change as well. It requires energy to promote an electron from one energy level to a higher one. This energy can be supplied by a photon whose energy E = hf = hc/λ.
Since the energy levels are quantized, only certain photon wavelengths can be absorbed. If a photon is absorbed, the electrons will be promoted to higher energy levels and will then fall back down into the lowest energy state (ground state) in a cascade of transitions. Each time the energy level of the electron changes, a photon will be emitted and the energy (wavelength) of the photon will be characteristic of the energy difference between the initial and final energy levels of the atom in the transition. The energy of the emitted photon is just the difference between the energy levels of the initial (ni) and final (nf) states.
The set of spectral lines for a given final state nf are generally close together. The lines for which nf = 2 are called the Balmer series and many of these spectral lines are visible. Students will be measuring the wavelengths of the Balmer series lines in this laboratory.
The photon energies E = hf for the Balmer series lines are given by the formula
hf = -13.6 eV(1/ni2 - 1/22) = 13.6 eV(1/4 - 1/ni2).
We may write hc/λ = 13.6 eV(1/4 - 1/ni2), or
1/λ = (13.6 eV(/hc))(1/4 - 1/ni2) = R(1/4 - 1/ni2).
The constant R is called the Rydberg constant. Students will experimentally determine the Rydberg constant in SI units.
Equipment needed:
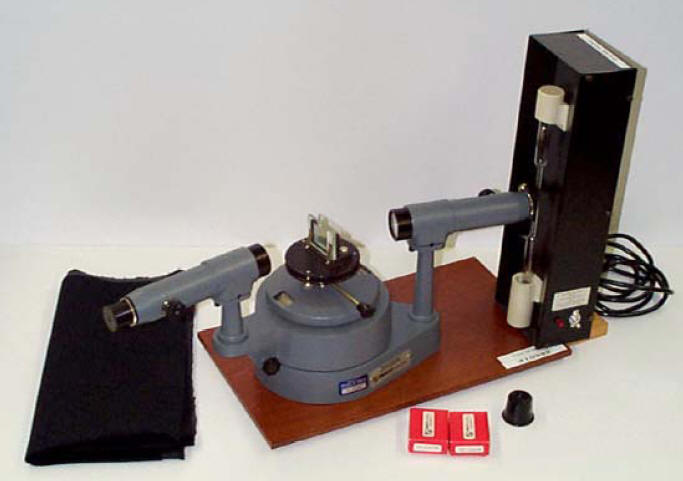
Pasco Model SP-9268 precision student spectrometer
a grating with 300 lines per mm
a hydrogen discharge lamp and power supply
a black cloth to black out stray light
Experiment:
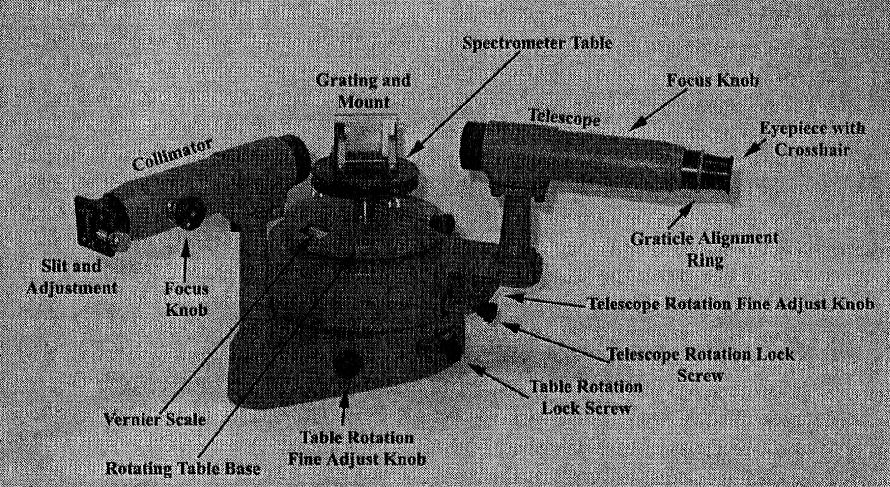
The different parts of the spectrometer are identified in the figure below.
The schematic diagram below illustrates its principle of operation.
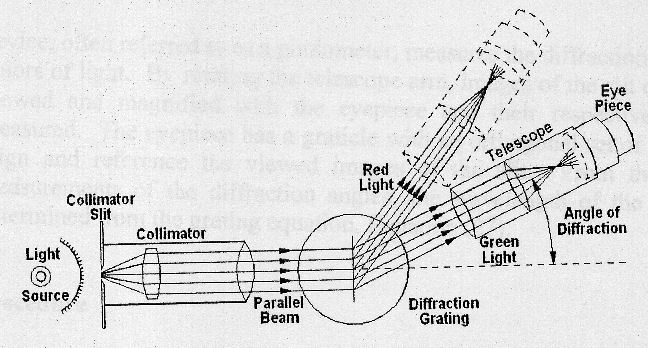
The spectrometer consists of a collimator tube with an adjustable entrance slit, a rotatable table on which the diffraction grating can be mounted, a telescope for observing the diffracted light, and an accurate angular scale for measuring the relative directions of the various spectrometer components. The diffraction grating disperses the light, so that the relationship between the diffraction angle θ and the wavelength λ of the light is given by the equation
dsinθ = mλ, m = 0, 1, 2, ... .
The integer n is referred to as the diffraction order.
For a 300 lines per mm grating d = (1/300) mm.
Students will measure the wavelengths for the ni = 3, 4, 5, and 6 lines in the Balmer
series of hydrogen by measuring the angle θ
through which the light of the lines is deflected by the grating in first order
(m = 1) and second order (m = 2).
Procedure:
Record your angular readings (in degree) for the violet (6 --> 2), violet-blue (5 --> 2), blue-green (4 --> 2), and red (3 --> 2) lines into columns D and E of the linked spreadsheet. This should be done for the first and second order right and left diffracted lines. (Note: The grating is strongly blazed. The lines on one side are much brighter than on the other side. You may not be able to see all the lines in second order on the weak side.)
Data analysis:
%difference = |calculated value - measured value|/calculated value